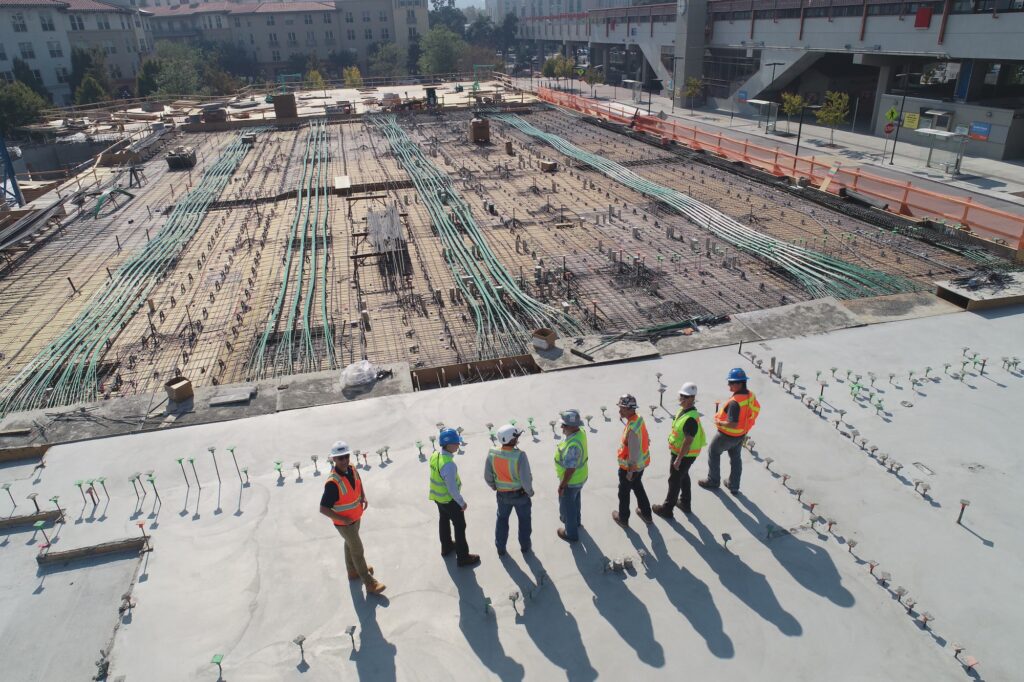
Keeping the Engine of Our Economy Safe
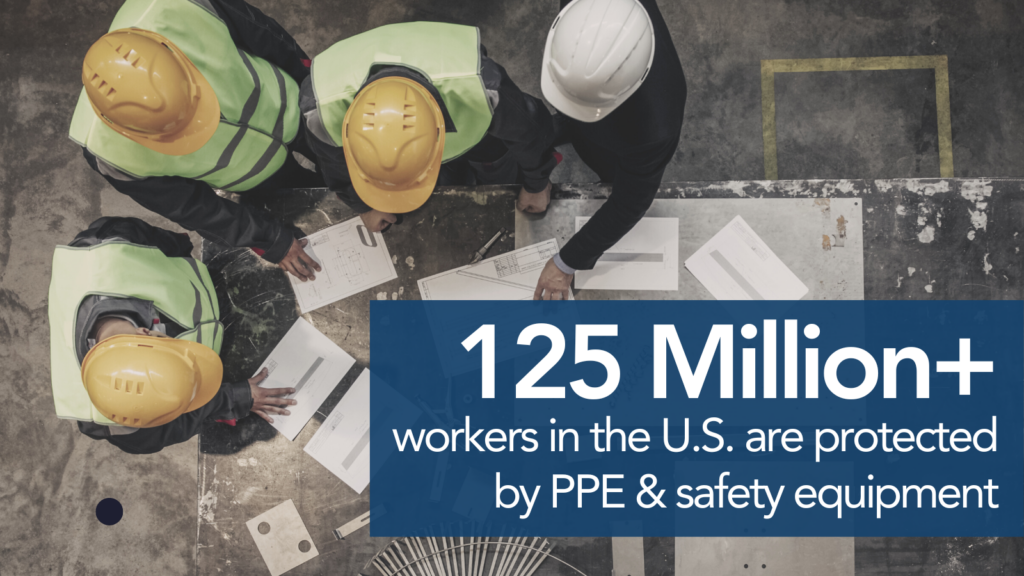
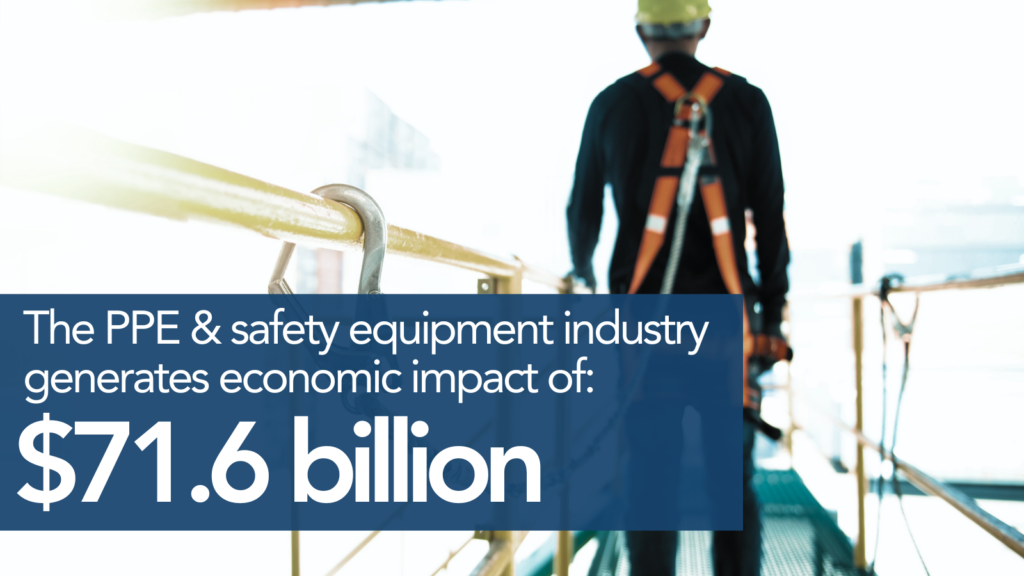
Our workers are the engine of the U.S. economy. The PPE and safety equipment proudly protects over 125,000,000 workers in the U.S., supports 350,000 jobs, and generates $72B of economic activity.
Our industry directly employs 130,000 workers and pays state and federal taxes of $9B.
Protecting Workers in Every Industry
Workers in nearly every sector of the $26.95 trillion U.S. economy rely on high-quality PPE and safety equipment to ensure they are protected on the job and able to return home safe at the end of their shift. Click on each protection category below to see how many workers our industry protects in critical industries.
| Industry | Workers Protected |
|---|---|
| Agriculture | 124,040 |
| Mining | 566,640 |
| Transportation | 1,807,170 |
| Construction | 8,923,870 |
| Manufacturing & Energy | 4,661,820 |
| Services | 30,616,010 |
| Retail & Wholesale | 6,030,960 |
| Medical | 10,850,140 |
| Misc. | 2,929,000 |
| Government | 4,770,740 |
| Total Workers Protected | 71,280,390 |
| Industry | Workers Protected |
|---|---|
| Agriculture | 756,360 |
| Mining | 566,640 |
| Transportation | 1,153,310 |
| Construction | 10,111,320 |
| Manufacturing & Energy | 4,818,540 |
| Services | 17,202,650 |
| Retail & Wholesale | 3,262,480 |
| Medical | 22,361,110 |
| Misc. | 2,154,380 |
| Government | 7,216,880 |
| Total Workers Protected | 69,358,370 |
| Industry | Workers Protected |
|---|---|
| Agriculture | 418,410 |
| Mining | 799,260 |
| Transportation | 1,778,030 |
| Construction | 10,636,260 |
| Manufacturing & Energy | 5,221,050 |
| Services | 38,278,710 |
| Retail & Wholesale | 4,607,760 |
| Medical | 23,681,420 |
| Misc. | 2,577,460 |
| Government | 6,555,000 |
| Total Workers Protected | 94,553,360 |
Fall Protection includes Harnesses, Climber straps/pads/footplates, Body belts, Saddles, Lanyards, Arrest systems, Walkway surface slip prevention, Window fall prevention, and Dropped object solutions.
| Industry | Workers Protected |
|---|---|
| Agriculture | 65,660 |
| Mining | 508,390 |
| Transportation | 976,680 |
| Construction | 7,834,460 |
| Manufacturing & Energy | 2,224,620 |
| Services | 18,151,330 |
| Retail & Wholesale | 1,237,970 |
| Medical | 9,045,140 |
| Misc. | 940,180 |
| Government | 4,117,510 |
| Total Workers Protected | 45,162,940 |
| Industry | Workers Protected |
|---|---|
| Agriculture | 415,580 |
| Mining | 323,070 |
| Transportation | 924,070 |
| Construction | 10,979,070 |
| Manufacturing & Energy | 1,135,320 |
| Services | 13,488,170 |
| Retail & Wholesale | 4,121,500 |
| Medical | 859,000 |
| Misc. | 261,130 |
| Government | 2,877,120 |
| Total Workers Protected | 35,384,030 |
| Industry | Workers Protected |
|---|---|
| Agriculture | 361,910 |
| Mining | 669,140 |
| Transportation | 1,100,970 |
| Construction | 10,295,550 |
| Manufacturing & Energy | 2,681,670 |
| Services | 9,099,160 |
| Retail & Wholesale | 2,702,310 |
| Medical | 610,960 |
| Misc. | 1,358,310 |
| Government | 4,413,220 |
| Total Workers Protected | 33,294,990 |
| Industry | Workers Protected |
|---|---|
| Agriculture | 433,180 |
| Mining | 925,550 |
| Transportation | 2,205,630 |
| Construction | 11,144,800 |
| Manufacturing & Energy | 6,010,950 |
| Services | 39,905,000 |
| Retail & Wholesale | 7,287,130 |
| Medical | 24,910,300 |
| Misc. | 3,564,760 |
| Government | 7,355,400 |
| Total Workers Protected | 103,742,700 |
| Industry | Workers Protected |
|---|---|
| Agriculture | 366,760 |
| Mining | 787,030 |
| Transportation | 1,548,930 |
| Construction | 10,115,050 |
| Manufacturing & Energy | 5,079,820 |
| Services | 10,141,760 |
| Retail & Wholesale | 3,502,890 |
| Medical | 1,031,000 |
| Misc. | 1,906,540 |
| Government | 5,609,520 |
| Total Workers Protected | 40,089,300 |
| Industry | Workers Protected |
|---|---|
| Agriculture | 434,460 |
| Mining | 1,010,010 |
| Transportation | 6,655,990 |
| Construction | 11,618,760 |
| Manufacturing & Energy | 13,019,420 |
| Services | 8,797,110 |
| Retail & Wholesale | 3,262,480 |
| Medical | 2,318,230 |
| Misc. | 3,063,790 |
| Government | 5,092,130 |
| Total Workers Protected | 92,276,000 |
| Industry | Workers Protected |
|---|---|
| Agriculture | 417,030 |
| Mining | 1,002,430 |
| Transportation | 2,401,590 |
| Construction | 10,961,310 |
| Manufacturing & Energy | 5,096,770 |
| Services | 40,011,980 |
| Retail & Wholesale | 5,805,120 |
| Medical | 25,353,740 |
| Misc. | 2,680,690 |
| Government | 8,263,240 |
| Total Workers Protected | 101,993,900 |
| Industry | Workers Protected |
|---|---|
| Agriculture | 316,150 |
| Mining | 541,980 |
| Transportation | 457,390 |
| Construction | 8,678,200 |
| Manufacturing & Energy | 3,185,930 |
| Services | 13,165,930 |
| Retail & Wholesale | 1,922,620 |
| Medical | 13,541,280 |
| Misc. | 1,110,920 |
| Government | 6,118,250 |
| Total Workers Protected | 48,953,470 |

Workers Protected by Industry and Occupation
Workers in nearly every industry and occupation in the United States rely on high-quality PPE and safety equipment to ensure they are protected.
ISEA members can dive deeper into the data to see how many workers are protected by each category of PPE and safety equipment by industry or occupation.
Impact by State & Congressional District
- Workers protected by industry & protection category
- Jobs created & wages paid
- Economic impact created
- Taxes paid
- 6.3M Manufacturing Workers
- 25.7M Medical Workers
- 42.9M Service Workers
- 11.6M Construction Workers
- 8.8M Government Workers